

Analytics & Reporting
Yugna provides comprehensive analytics to ensure you always know exactly what is happening across your network, without having to physically visit your screen locations.
Our reporting is broken down into two levels: Skimming Analytics (for high-level daily tracking directly in the dashboard) and Deep Analytics (for second-by-second forensic auditing).
Dashboard Skimming Analytics
Section titled “Dashboard Skimming Analytics”The Reports tab in your dashboard provides a rapid, high-level overview of your network’s health and content performance. You can easily toggle between Playlist-level and Screen-level summaries.
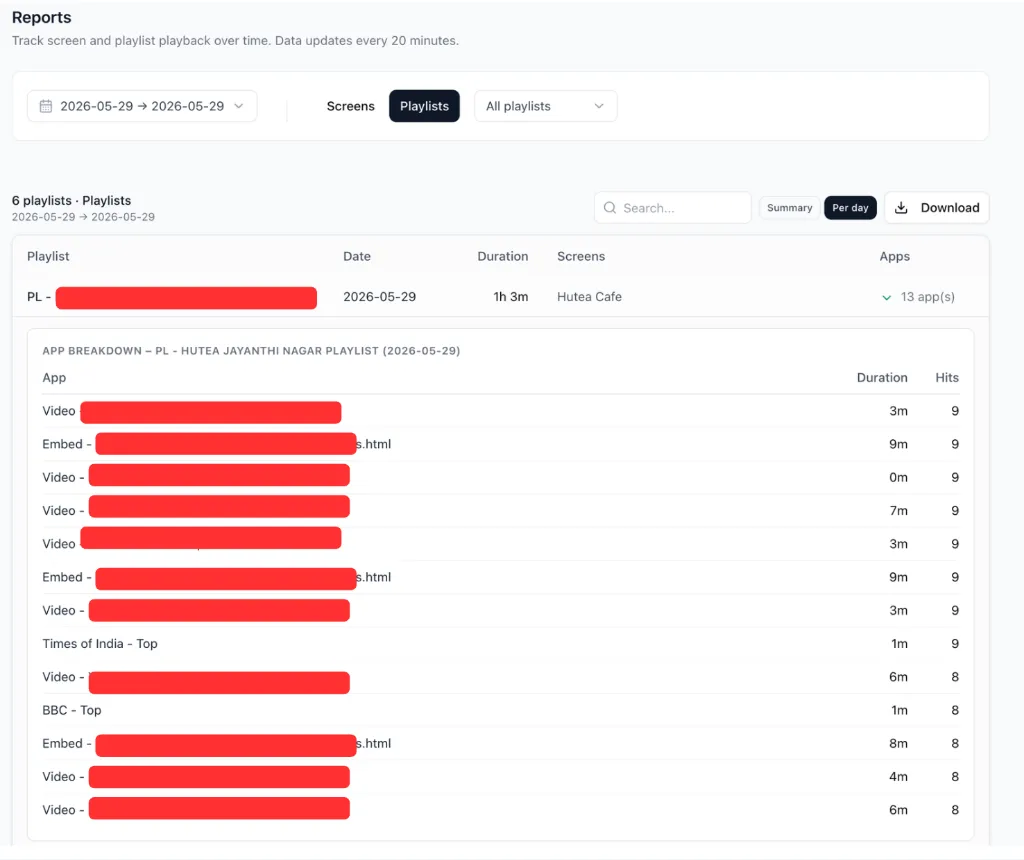
Playlist Reports
Section titled “Playlist Reports”The Playlist view allows you to see exactly which apps and scenes played on your network, broken down by total duration and total hits. This is excellent for quickly verifying that a specific campaign ran successfully.
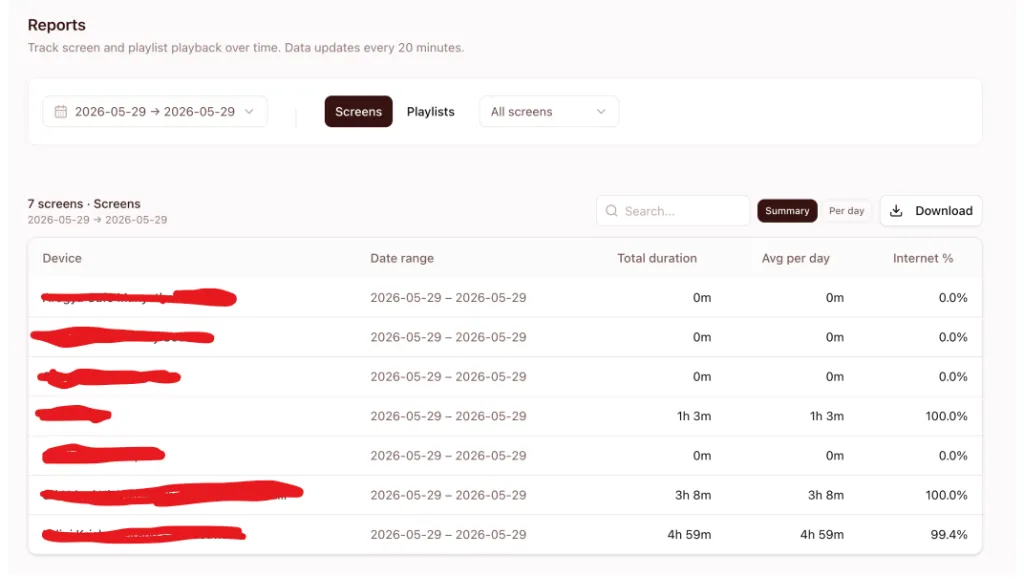
Screen Reports
Section titled “Screen Reports”The Screens view provides health and uptime metrics for your physical hardware. You can monitor the total playback duration per day, as well as the screen’s internet connectivity percentage, allowing you to easily spot hardware that is frequently going offline.
Deep Analytics (Second-by-Second Logs)
Section titled “Deep Analytics (Second-by-Second Logs)”For enterprise networks, retail stores, or advertising networks that require concrete Proof of Play, high-level skimming is often not enough. Advertisers may require proof that their video played at a specific second of the day.
For this, Yugna provides Deep Analytics. These are highly detailed, second-by-second logs generated directly by the player hardware.
You can download these raw logs as a CSV file to import into Excel or your own internal reporting tools.